UNC Systems Genetics
| Home |
| Genetics | G3 Multiparental Populations (2017) |
| Genetics | G3 Special Issue (2012) |
| CC Mice |
| Information |
| Available Strains |
| Conditions of Use |
| CC Viewer |
| Locus Probabilities |
| Founder Probabilities |
| CC Genomes |
| CC Gene Expression |
| Genotypes |
| Platform Overviews |
| Imputed |
| MDA Tools |
| Mouse Phylogeny Viewer |
| Data |
| Genetics 2017 |
| Genetics 2012 |
| Publications |
| Order Mice |
| Contact Us |
Description
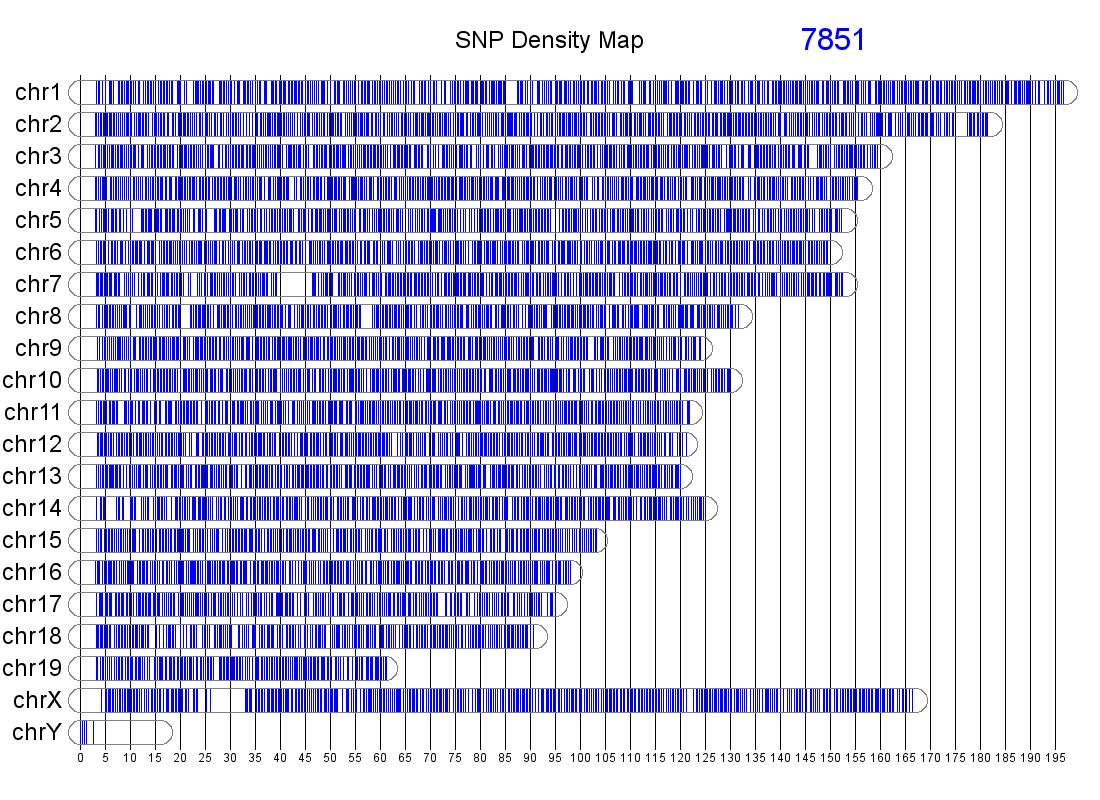
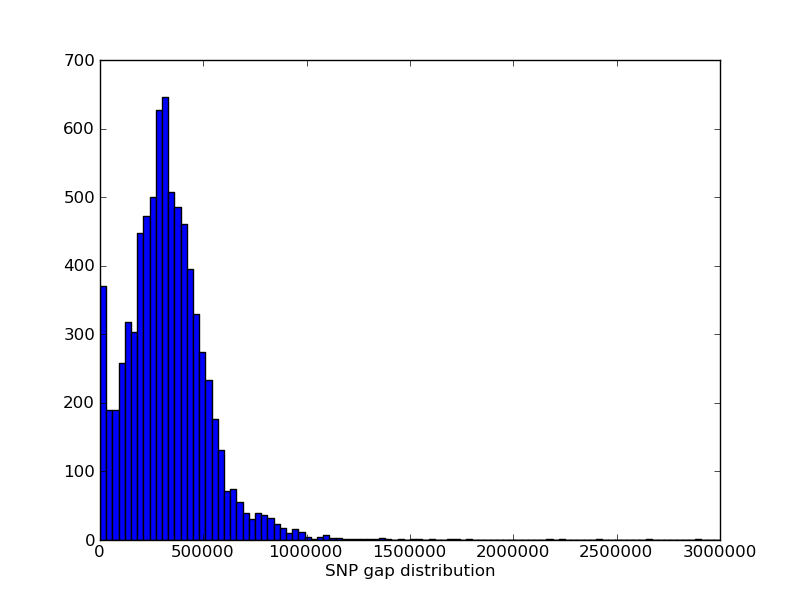
The genomic distribution of MUGA markers. The genomic position of each MUGA marker is shown on the left. The right figure illustrates the distribution of SNP spacing on MUGA. Click on either for a larger image.
We provide MUGA genotypes for the 458 samples from the developing CC lines described in the February 2012 issue of Genetics. In addition, we also provide genotypes for 168 reference strains that include biological and technical replicates for the the 8 CC founder strains and their F1 crosses.
Genotype calls are those reported by Illumina. All results are provided as comma separated files with one row per marker. Each marker is identified by a probe name and its genomic position in NCBI Build 37.
If you use these genotypes we request that you cite the following publication:
Collaborative Cross Consortium, The Genome Architecture of the Collaborative Cross Mouse Genetic Reference Population. Genetics 2012, vol. 190, no. 2, pp. 389-402.
Instructions
Press the "+" to expose the samples in any group. Check all samples that you wish to be included in the final genotype report. When finished, choose whether to filter bad SNPs and/or to include normalized probe intensities (there are 2 per SNP per sample). Finally, choose [Submit] to extract the chosen genotypes.
Related Tools
- MUGA marker cluster visualization
- MUGA sample call visualization
- Visualize the genome structure of CC lines with founder assignments