UNC Systems Genetics
| Home |
| Genetics | G3 Multiparental Populations (2017) |
| Genetics | G3 Special Issue (2012) |
| CC Mice |
| Information |
| Available Strains |
| Conditions of Use |
| CC Viewer |
| Locus Probabilities |
| Founder Probabilities |
| CC Genomes |
| CC Gene Expression |
| Genotypes |
| Platform Overviews |
| Imputed |
| MDA Tools |
| Mouse Phylogeny Viewer |
| Data |
| Genetics 2017 |
| Genetics 2012 |
| Publications |
| Order Mice |
| Contact Us |
Description
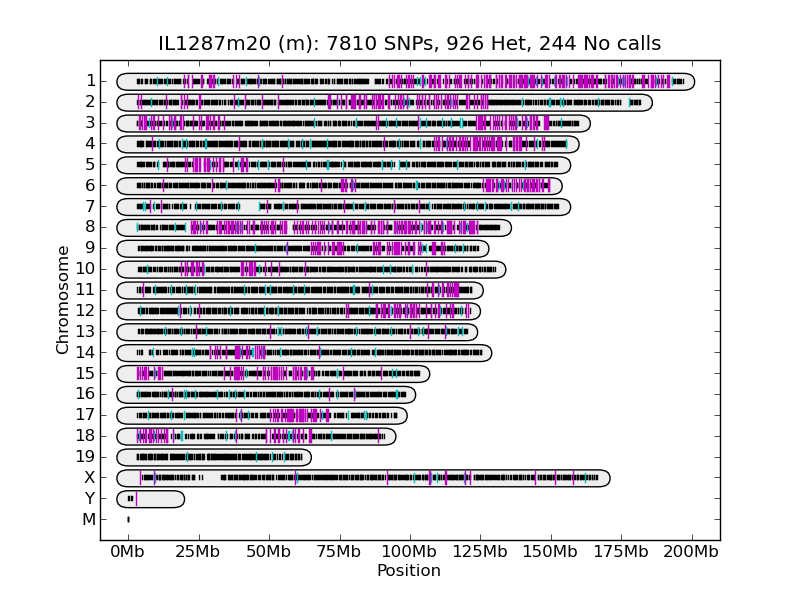 The MUGA Genotype Display depicts the genotypes of your selected samples as they appear in the genome. Genotype calls are those reported by Illumina and can be any of the following values: A, G, C, T, H or N. The small black lines represent the location of the SNPs on MUGA that are fixed for 1 allele (A, G, C, or T), while the magenta lines depict heterozygous calls (H) and the cyan lines depict no calls or Ns. The counts of each type of SNP are included in the image title. You may choose to filter the SNPs to cut out possible noise from bad SNPs.