UNC Systems Genetics
| Home |
| Genetics | G3 Multiparental Populations (2017) |
| Genetics | G3 Special Issue (2012) |
| CC Mice |
| Information |
| Available Strains |
| Conditions of Use |
| CC Viewer |
| Locus Probabilities |
| Founder Probabilities |
| CC Genomes |
| CC Gene Expression |
| Genotypes |
| Platform Overviews |
| Imputed |
| MDA Tools |
| Mouse Phylogeny Viewer |
| Data |
| Genetics 2017 |
| Genetics 2012 |
| Publications |
| Order Mice |
| Contact Us |
Description
Each MUGA marker is characterized by two hybridization intensities. The MUGA genotype cluster plots displays Illumina's normalized intensity values for a specified marker. For each chosen marker, these plots display all MUGA samples. They are colored according to either Illumina's genotype calls, or as a gray point except for samples from the 8 CC founder strains, which are highlighted in their respective colors.
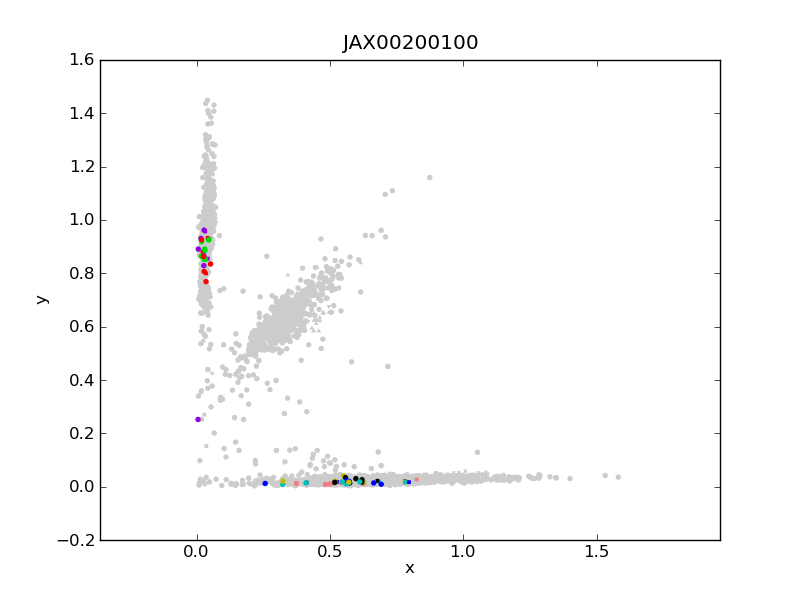
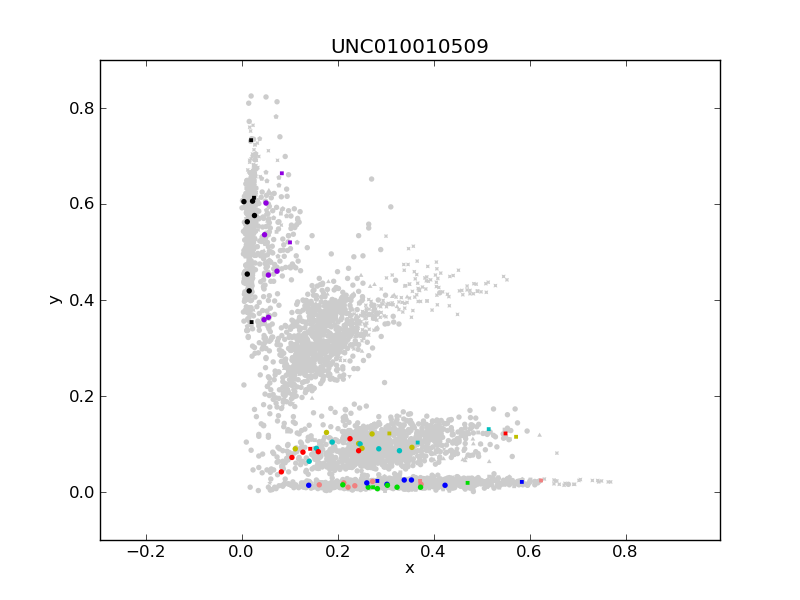
Two example MUGA marker clusters. The left cluster is a typical biallelic SNP, while the marker on the right shows evidence of four alleles. Click on either for a larger image.
A typical biallelic marker clusters into three groups: two homozygous and one heterozygous. However, a significant portion of MUGA markers exhibit more than three alleles, resulting in an intensity pattern with more than three clusters. These additional clusters, as well as subclusters within genotype clusters can be attributed to subtle differences in the genomic sequence, such as unreported genetic variants within or nearby probes. For example, the first X-Y plot shown on the right is a typical biallelic marker. One allele cluster is aligned with the x-axis, the second is aligned with the y-axis, and the heterozygous samples cluster along the diagonal. A second example X-Y plot is shown on the far right of a marker that shows evidence of multiple alleles with four separate homozygous clusters among the 8 CC founders. We can also see clear clusters of heterozygous samples lying between the homozygous clusters.
Instructions
 Begin by entering one or more marker names, separated by commas, below. Ex: JAX00200100, UNC090374068. If you do not know marker names, click on a region in the genome shown below to select markers in that region. Select the type of plot desired: x-y plots display the normalized x and y intensities, θ-r plots transform the x and y intensities into polar coordinates, and contrast-mean intensity plots display the contrast (x-y)/(x+y) on the x-axis and the (x+y)/2 intensity on the y-axis.
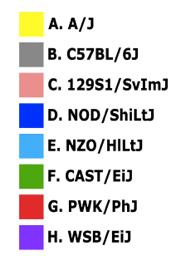
If "highlight CC founders" is selected, the 8 CC founders will be highlighted in their respective colors, shown to the right. If "highlight CC founders" is not selected, every sample will be colored according to the nucleotide of their Illumina genotype calls: "A" is in green, "C" is in blue, "G" is in black, "T" is in red, and "H" for "heterozygous" is in magenta.
Choose Markers
Enter marker names separated by commas (ex. JAX00200100, UNC010010509). If you do not know marker names, click on a region in the genome shown below to select markers in that region.