UNC Systems Genetics
| Home |
| Genetics | G3 Multiparental Populations (2017) |
| Genetics | G3 Special Issue (2012) |
| CC Mice |
| Information |
| Available Strains |
| Conditions of Use |
| CC Viewer |
| Locus Probabilities |
| Founder Probabilities |
| CC Genomes |
| CC Gene Expression |
| Genotypes |
| Platform Overviews |
| Imputed |
| MDA Tools |
| Mouse Phylogeny Viewer |
| Data |
| Genetics 2017 |
| Genetics 2012 |
| Publications |
| Order Mice |
| Contact Us |
Description
The Collaborative Cross (CC) is a multiparental recombinant inbred panel derived from eight laboratory mouse strains. After six years of development, we genotyped 458 extant lines from the three breeding populations (UNC, TAU, and GND) using a custom genotyping array with 7500 SNPs called MUGA. This genotyping has been used to assess the current state and properties of the emerging CC as a genetics resource. As designed, the CC will significantly improve the ability to map genetic effects and it lacks population structure. Linkage disequilibrium decays as expected, and there is no evidence of gametic disequilibrium in the CC as a whole or when taken in random subsets. Gametic equilibrium in the CC population is in marked contrast to that present in classical inbred strains. Furthermore, genotyping was used to identify lines with breeding errors and cousin lines generated by splitting incipient lines into two or more cousin lines at early generations of inbreeding.
The data shown in the table below is from:
Collaborative Cross Consortium, The Genome Architecture of the Collaborative Cross Mouse Genetic Reference Population. Genetics 2012, vol. 190, no. 2, pp. 389-402.
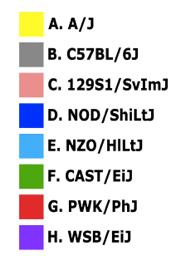
The statistics from each CC line are derived from MUGA genotypes extracted from a single genotyped male at the most advanced generation from each line as of 01/01/2010. Beside each sample's name are icons for viewing the founder mosaic inferred for every genomic region. We also provide a text file with detailed founder interval boundaries. The colors and letter designations for each strain are shown in the strain guide figure on the right.
Each sample is labeled according to its original breeding population (UNC, TAU, or GND) and a number identifying each line. Some sample labels include a prefix indicating any abnormalies within the line (e.g. i = incomplete; genotyping indicates that all 8 founders are not present; r = related, indicating a non-independent line). The columns labeled A-H depict the percentage of each of the 8 founders present in the sample. The "Het %" column reports the amount of residual heterozygosity in the sample analyzed, and the "Founders" column gives a count of the number of founders detected in the sample.
A second table of aggregated statistics for each population is provided below.
Instructions
To view the statistics from a particular population, select the appropriate checkboxes and click the [Submit] button. This will cause the contents of the table to be updated. Either table's contents can be sorted by a column's contents by clicking on its header label. A second click on a header label will reverse the direction of the sort. A link is provided for downloading the table's contents as a file of comma-separated values.
To view Supplementary Materials from this publication, click here.